NUMBERS STRAND
PLACE VALUE

CENTRAL IDEA :
Place value influences the way we read, write, compare and order numbers.
LINES OF INQUIRY :
TEACHER QUESTIONS :
Place value influences the way we read, write, compare and order numbers.
LINES OF INQUIRY :
- Understanding place value using the base 10 system.
- Reading, writing, and modeling numbers.
- Ordering and comparing number
TEACHER QUESTIONS :
- Does every number have value?
- What is place value?
- Why do we need to know about place and number value?
- What things are connected with place value and number value in our daily life?
STRATEGIES TO TEACH PLACE VALUE


|

|
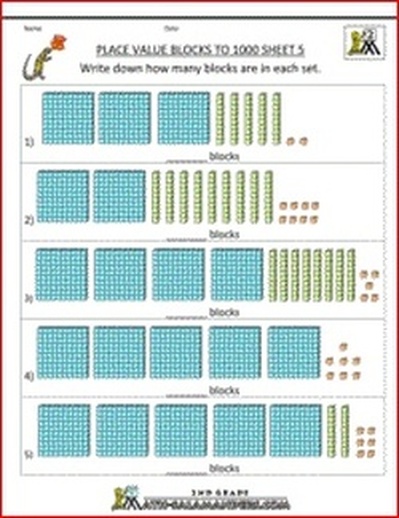
DAILY EXERCISE , HERE SOME WORKSHEETS

|
|
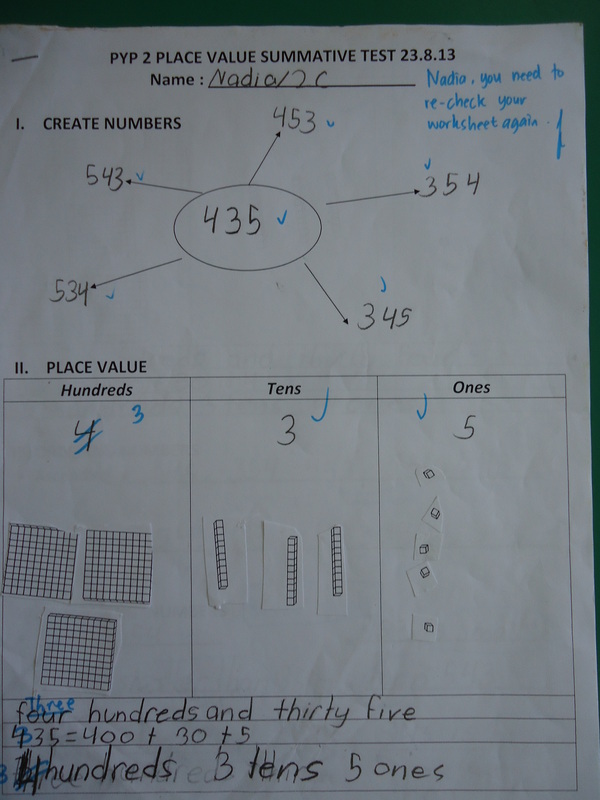
PLACE VALUE SUMMATIVE TASK
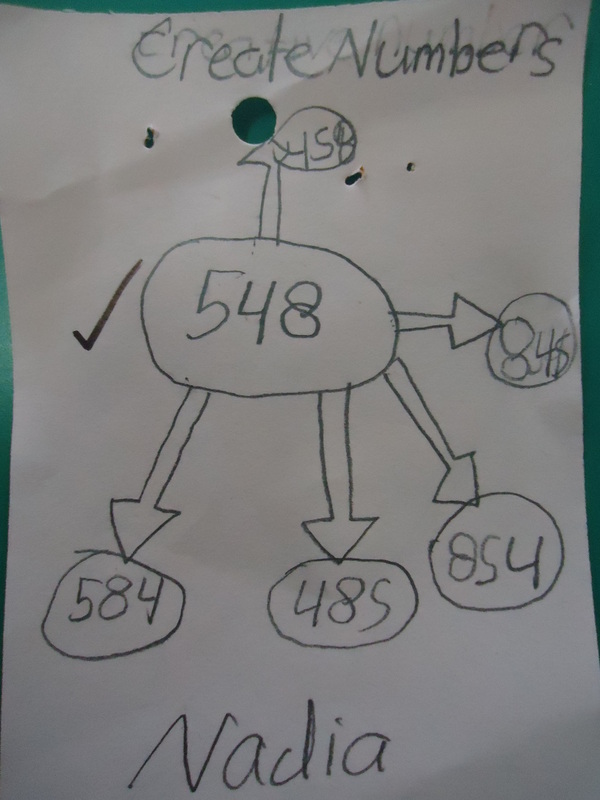
Students create some numbers from 3 differnce numbers using main map. They show the place value using place value grid. Then they write the number
value, symbol and also words. They also should compare those numbers and put
those numbers in order from the least to the greatest vice versa
|
|
ADDITION AND SUBTRACTION

CENTRAL IDEA :
Addition and subtraction help us to process information in order to solve problems.
LINE OF INQUIRY
- The
language and symbols of addition and subtraction
- Ways of solving problems using addition and subtraction
- Able to apply place value concepts to solve addition
and subtraction problems
TEACHER QUESTIONS :
- What is addition ?
- What is subtraction?
- When do we use addition?
- When do we use subtraction?
- What things are connected with addition in our daily life?
- What things are connected with subtraction in our daily life?
|
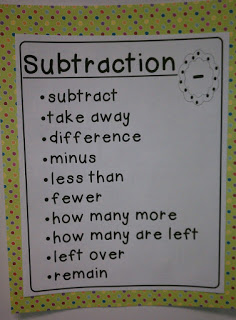
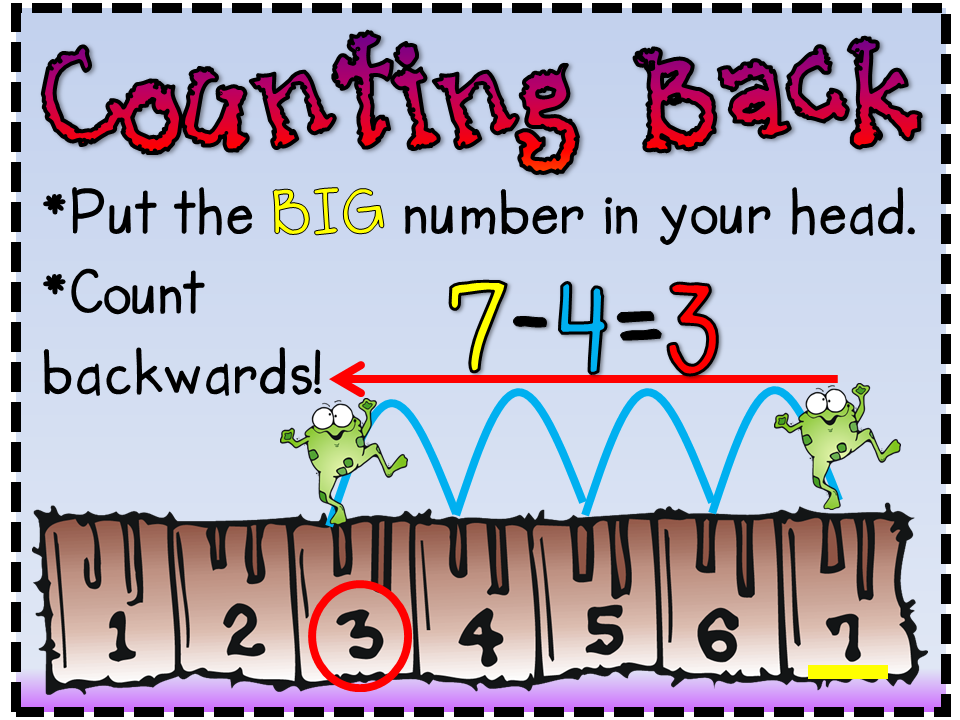
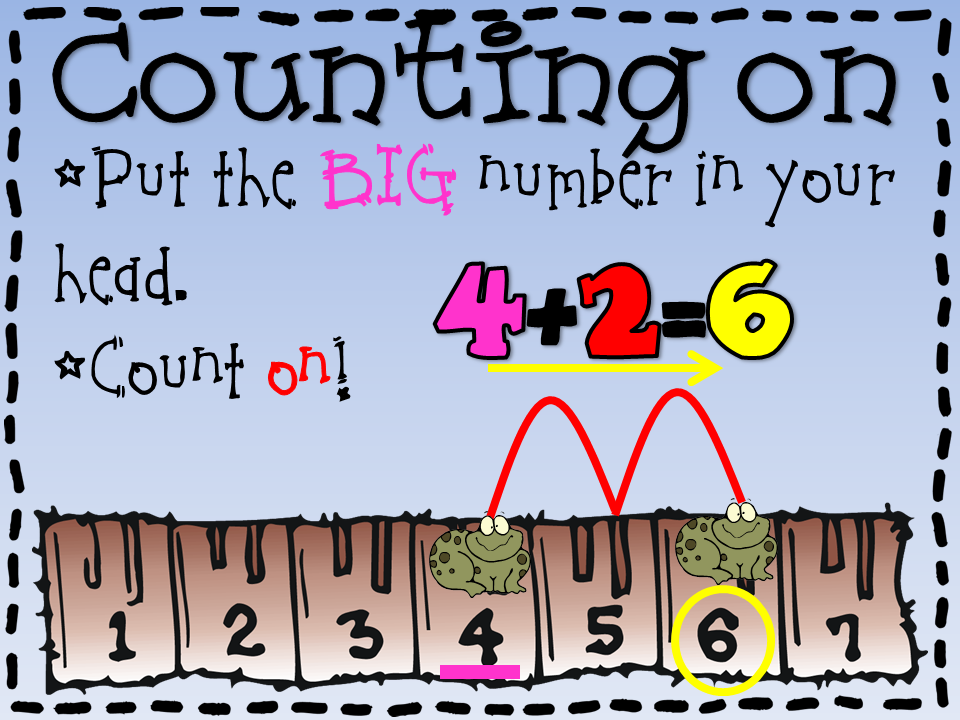
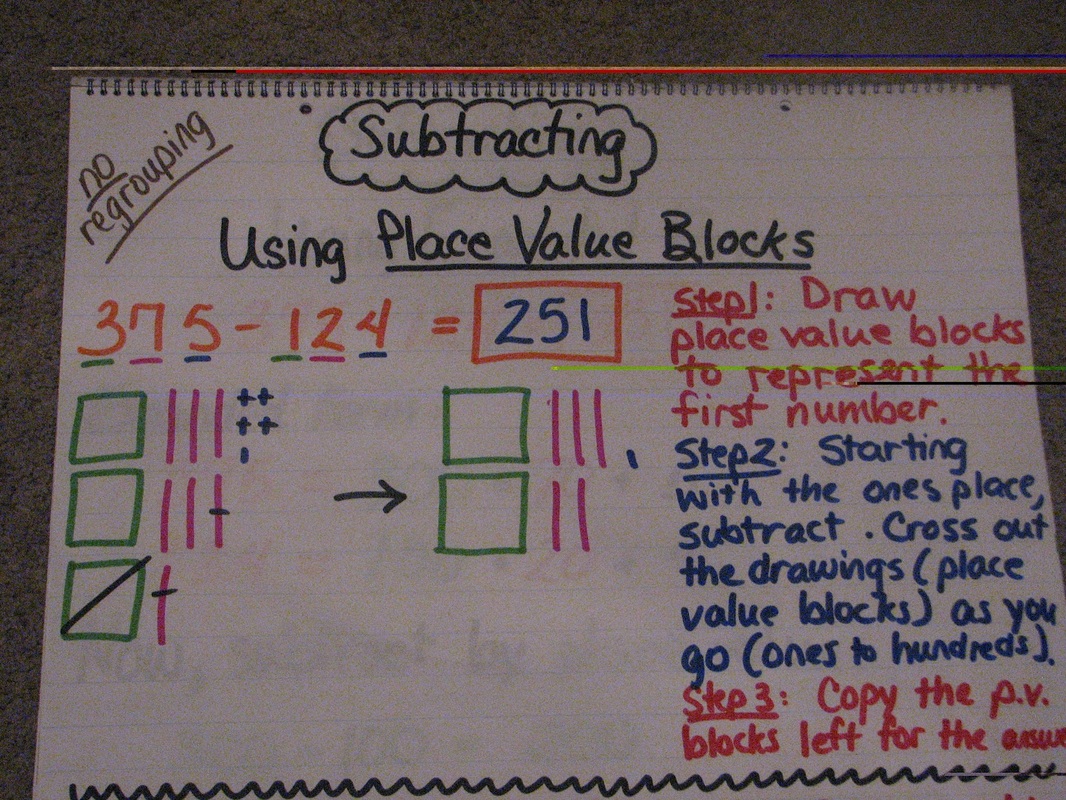
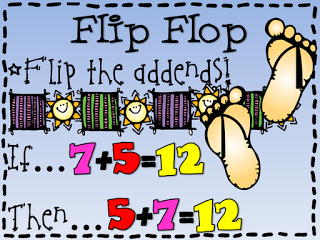
STRATEGIES TO TEACH :
1. Keyword / vocabulary of addition and subtraction 2. Practice addition and subtraction without and with saving using chart or use different strategies such as counting forward, counting backward, and number line, etc.
|
|
|

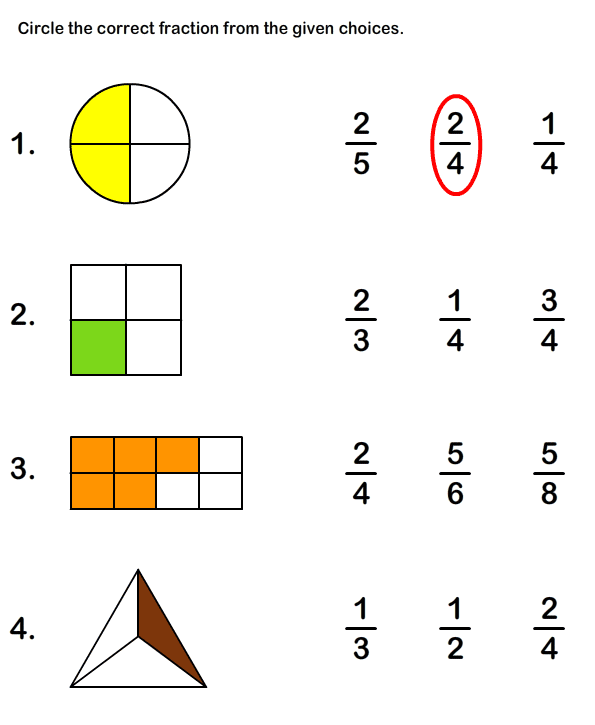
FRACTION : PART OF A WHOLE
|
CENTRAL IDEA:
Fractions are used to tell us the parts of things LINES OF INQUIRY :
THE IDEAS TO TEACHING LEARNING ABOUT FRACTION :
|
PLEASE STUDY ABOUT FRACTION FROM THESE MOVIES
|
|
LET'S CHECK UP YOUR UNDERSTANDING ON FRACTION BY DO THESE WORKSHEET
|

|

|

|

|

|
MULTIPLICATION AND DIVISION
|
|
SOME POSSIBLE STRATEGIES
TO TEACH MULTIPLICATION AND DIVISION
TO TEACH MULTIPLICATION AND DIVISION
|

Have a look the process to find out the product
|

SHAPE AND SPACE STRAND
2 DIMENSION AND
3 DIMENSION SHAPES |
Central Idea:
2D and 3D shapes are related and we can describe the ways they are similar and different using special vocabulary. Lines of Inquiry: 1. Relationship between 3D and 2D shapes 2. Similarities and differences between 2D and 3D shapes 3. Difference between area and perimeter concepts 4. Area and perimeter of 2D shapes Learning Outcome/s: 1. Students are able to show how 2D and 3D shapes are related. 2. Students are able to find the area and perimeter of 2D shapes in a simple way |
|
LEARNING ENGAGEMENT:
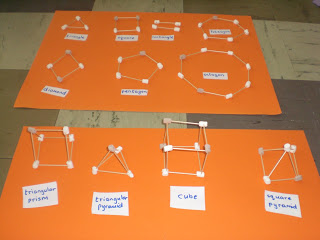
1. Show a picture of ‘Dancow’ box and a real ‘Dancow’ box (or any boxes). Discuss the differences and similarities between them. Use other examples by showing pictures and real things to help students understand the similarities and the differences between 3D and 2D shapes. 2. List 2D and 3D shapes around the students (things at home and things at school) 3. Ask the students to bring boxes in different forms. 4. Explore 3D shapes (cubes, rectangular prism, cone, square based pyramid, cylinder and sphere) to know the faces by breaking them down into 2D shapes. They can write: A cube is made of 6 squares. 5. Explain the concepts of area and perimeter in units. Area= counting inside the shapes, Perimeter= counting the outside/outline of the shapes Nice to know:
· Sides = sisi (for 2D shapes) · Faces = sisi (for 3D shapes) · Corners/Vertex/vertices= titik sudut · Edges= rusuk · A cone does not have a vertex but an apex (titik puncak) Assessment Task:
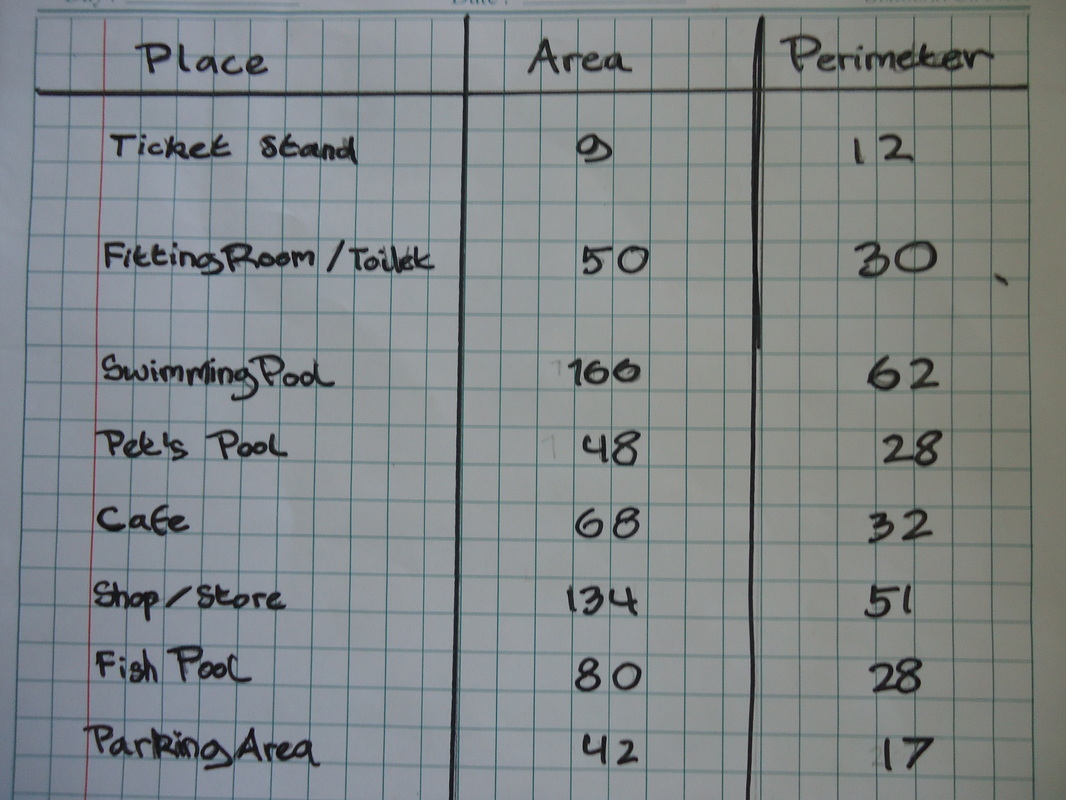
· Students make 3D shapes (cube, rectangular prism, square based pyramid and triangular prism) using nets provided and describe the characteristic of those shapes. Then they explain how 2D and 3D shapes are related. E.g.: It is a cube. It has 6 faces, 8 vertices and 12 edges. A cube is made of 6 squares. · Students draw some place (2D Shapes) and the things inside the place (Rectangle and Square) ; identify the perimeter and area of the place. Count the perimeter and area of the place. à Using square paper, the ways to solve up to the students ( can be count the outline for perimeter, count the boxes inside the shape for area OR using formula/other strategy) |


|
PATTERN AND FUNCTION STRAND
|
Central Idea
Identifying patterns help us to recognize and solve problem easier. WALT: Students are able to identify and extend patterns in numbers. Lines Of Inquiry:
|
Extended activities
· Give students problems Ex: During holidays, Tania picked apples at the orchard. She paid 10 c for the first bucket of apples, 20c for the second bucket of apples and 40c for the third bucket of apples. How much did she pay for the seventh bucket of apples? · Use calendar to create problems. · Let students solve those problems by identifying and extending patterns. Summative Task: Students create their own word problem and solve it. Example: Everyday Lisa bought 2 books. She bought those books in 7 days. How many books she collect on 7th day and 4th day? |
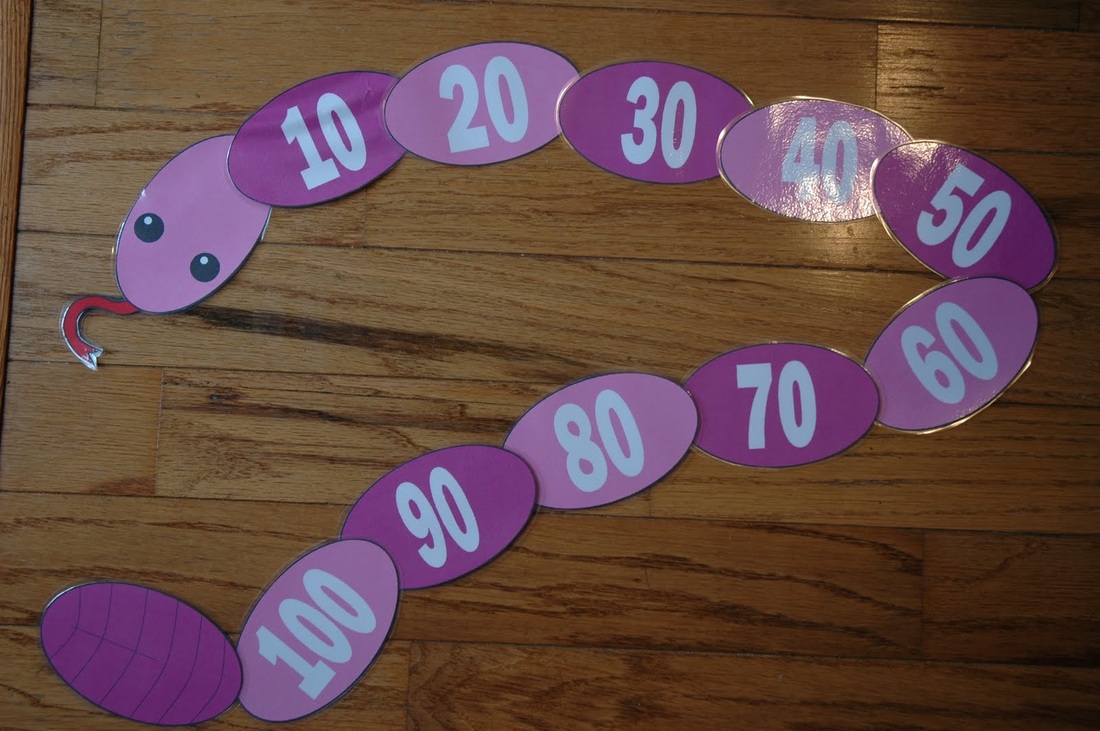
TEACHING STRATEGIES TO TEACH NUMBER PATTERN

|

|

|
|
DATA HANDLING
|
Central Idea:
Graphs help us to present and interpret information Lines of inquiry: · Ways of organizing information. · Ways of displaying data. · Interpreting data/ information from graphs Provocation questions: 1. What is graph? 2. Where do you see graph in daily life? 3. How do you use graph? 4. What does the graph tell you? 5. How do you get the information from the graph? Knowledge for teachers: What is pictograph? Pictograph is a pictorial representation of statistics on a chart, graph, or computer screen. What is 'interpreting data'? Data means information. So interpreting data just means working out what information is telling you. Information is sometimes shown in tables, charts and graphs to make the information easier to read. It is important to read all the different parts of the table, chart or graph. 
|
Learning Engagement
Collecting and recording some data + Displaying the data: · Teachers should select a classroom event or routine that is suitable for graphing. · Begin with a discussion about the need to record the data and discuss what benefit a record will be. · Pose questions that could be answered and ask for student suggestions. - describes characteristics and gives examples of graphs for students · Students draw a picture of themselves and place it appropriately on the graph. At an earlier level, the pictures need not be of the same size, · When the graph is finished, use it to answer questions such as 'how many children …'; 'on what day do the most/least/exactly 3 children …' etc. · Conclude with students reflecting on the benefit of having pictures of the same size and placed uniformly for answering 'how many' questions. Interpreting the data · Give the students a data about students’ hobby in the class as the example in form of bar graph and pictogram. · Ask them some questions to get information given from the graph. · Introduces the students about more than, fewer than, the most and the least in interpreting the data. RESOURCES : http://www.bbc.co.uk/bitesize/ks2/maths/data/interpreting_data/play/ http://www.topmarks.co.uk/PlayPop.aspx?f=pictograms http://www.sciencekids.co.nz/gamesactivities/math/frequencytables.html 
|
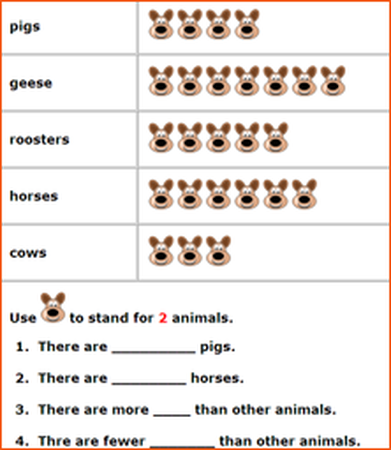
READING PICTOGRAPH

Please make an other questions !
|

|
|
|
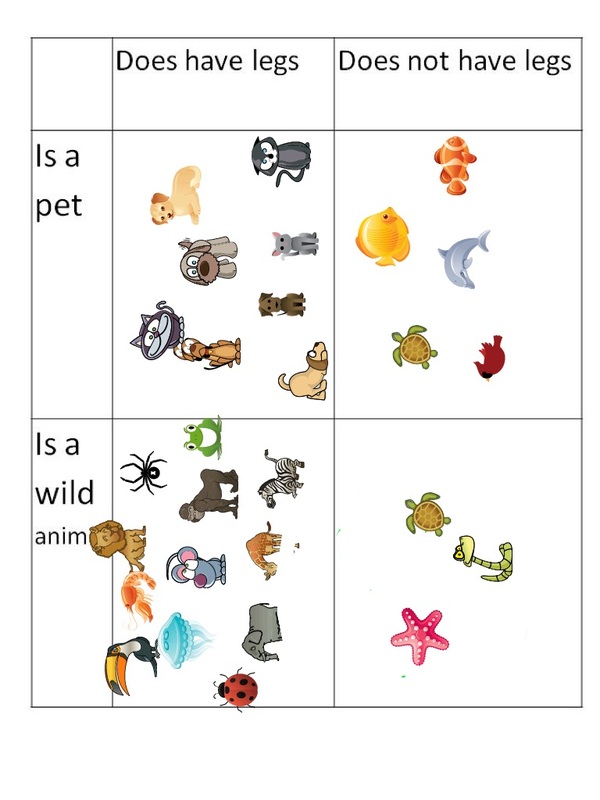
Now, learnt about CARROLL DIAGRAM
|


|
